A guide for debugging Vector pipelines
Step by step guide for debugging pipelines

Imagine we have two log sources. We want to parse their events, assign a group ID, and send the logs to an HTTP server. How do we find out what went wrong when those logs stop arriving?

In this guide, we’ll start with a working pipeline, introduce three common failures, and use Vector’s logs and metrics to fix them. You’ll also see how to inspect events as they move through the pipeline.
Getting started
You’ll need Vector, Python, and curl.
Run the examples on the same machine, with ports 8000 and 8686
available. The Python server uses only the standard library, so you don’t need to install any Python packages.
Download all guide files as a ZIP.
Extract it and open the folder containing http-server.py.
"""Local HTTP destination for the Vector debugging guide. Uses only Python's standard library."""

import argparse
import json
from http import HTTPStatus
from http.server import BaseHTTPRequestHandler, HTTPServer
import zlib


class DebuggingHTTPRequestHandler(BaseHTTPRequestHandler):
    def send_json(self, status, message):
        body = json.dumps({"message": message}).encode()
        self.send_response(status)
        self.send_header("Content-Type", "application/json")
        self.send_header("Content-Length", str(len(body)))
        self.end_headers()
        self.wfile.write(body)

    def do_POST(self):
        if self.path not in ("/logs", "/set_status"):
            self.send_json(HTTPStatus.NOT_FOUND, "Use /logs or /set_status.")
            return

        try:
            content_length = int(self.headers.get("Content-Length", "0"))
            if content_length < 0:
                raise ValueError
        except ValueError:
            self.send_json(HTTPStatus.BAD_REQUEST, "Invalid Content-Length.")
            return

        body = self.rfile.read(content_length)
        encoding = self.headers.get("Content-Encoding", "identity")
        print(f"\nReceived POST {self.path}", flush=True)
        print(self.headers, end="", flush=True)

        if encoding == "deflate":
            try:
                body = zlib.decompress(body)
            except zlib.error:
                self.send_json(HTTPStatus.BAD_REQUEST, "Invalid zlib-compressed data.")
                return
        elif encoding != "identity":
            message = f"Unsupported compression: {encoding}. Use zlib or no compression."
            print(message, flush=True)
            self.send_json(HTTPStatus.BAD_REQUEST, message)
            return

        if (
            self.path == "/logs"
            and self.server.max_bytes is not None
            and len(body) > self.server.max_bytes
        ):
            message = (
                f"Payload is {len(body)} bytes; limit is {self.server.max_bytes} bytes "
                "after decompression."
            )
            print(message, flush=True)
            self.send_json(HTTPStatus.REQUEST_ENTITY_TOO_LARGE, message)
            return

        try:
            data = json.loads(body)
        except (json.JSONDecodeError, UnicodeDecodeError):
            self.send_json(HTTPStatus.BAD_REQUEST, "Expected a JSON payload.")
            return

        if self.path == "/set_status":
            status = data.get("status") if isinstance(data, dict) else None
            if type(status) is not int or not 200 <= status <= 599:
                self.send_json(
                    HTTPStatus.BAD_REQUEST,
                    "Send a JSON object with an integer status between 200 and 599.",
                )
                return
            self.server.response_code = status
            self.send_json(HTTPStatus.OK, f"Response code updated to {status}.")
            return

        print("JSON payload:", json.dumps(data, indent=2), flush=True)
        self.send_json(self.server.response_code, f"Responding with {self.server.response_code}.")


if __name__ == "__main__":
    parser = argparse.ArgumentParser(description=__doc__)
    parser.add_argument(
        "--max-bytes",
        type=int,
        help="Reject /logs payloads larger than this many bytes after decompression.",
    )
    args = parser.parse_args()
    if args.max_bytes is not None and args.max_bytes <= 0:
        parser.error("--max-bytes must be positive")

    with HTTPServer(("127.0.0.1", 8000), DebuggingHTTPRequestHandler) as server:
        server.response_code = HTTPStatus.OK
        server.max_bytes = args.max_bytes
        print("Serving on http://127.0.0.1:8000", flush=True)
        try:
            server.serve_forever()
        except KeyboardInterrupt:
            print("\nServer shutting down.", flush=True)
Initial Vector configuration
vector-start.yaml connects two demo_logs sources to a remap transform and an http sink. A separate console sink prints Vector’s
internal metrics every five seconds.
api:
  enabled: true

sources:
  source_0:
    type: demo_logs
    format: shuffle
    lines:
      - '{ "key": "a", "property": "foo" }'
      - '{ "key": "b", "property": "bar" }'
    interval: 0.1

  source_1:
    type: demo_logs
    format: shuffle
    lines:
      - '{ "key": "c", "property": "some" }'
      - '{ "key": "d", "property": "another" }'
    interval: 0.1

  internal_metrics:
    type: internal_metrics
    scrape_interval_secs: 5

transforms:
  transform_0:
    type: remap
    inputs:
      - source_*
    source: |
      . = parse_json!(.message)
      if .key == "a" {
        .group = 0
      } else {
        .group = 1
      }

sinks:
  sink_0:
    type: http
    inputs:
      - transform_0
    uri: http://127.0.0.1:8000/logs
    healthcheck:
      enabled: false
    encoding:
      codec: json
    batch:
      timeout_secs: 1

  sink_1:
    type: console
    inputs:
      - internal_metrics
    encoding:
      codec: json
Start the Python HTTP server
In the first terminal, run:
python3 http-server.py
You should see:
Serving on http://127.0.0.1:8000
Keep this terminal open. The server accepts JSON at /logs and returns HTTP 200 by default. Later, we’ll change its responses to
simulate failures. You can read http-server.py to see how it works. You don’t need to edit it for this walkthrough.
Start Vector
In a second terminal, from the same directory, run:
vector --watch-config --config vector-start.yaml
The --watch-config flag reloads the configuration when you save changes. Keep this process running while you work through the scenarios.
The example disables the HTTP sink’s startup health check because our server only implements the POST endpoints used in this guide.
In the server terminal, look for Received POST /logs followed by a JSON array. One of its events should look like this:
{
  "group": 0,
  "key": "a",
  "property": "foo"
}
The access log should show an HTTP 200 response. Now we have a working baseline to compare against when something breaks.
Understanding the configuration
API
api:
  enabled: true
The API lets vector top and vector tap connect to this Vector process.
Sources
sources:
  source_0:
    type: demo_logs
    format: shuffle
    lines:
      - '{ "key": "a", "property": "foo" }'
      - '{ "key": "b", "property": "bar" }'
    interval: 0.1

  source_1:
    type: demo_logs
    format: shuffle
    lines:
      - '{ "key": "c", "property": "some" }'
      - '{ "key": "d", "property": "another" }'
    interval: 0.1
The two sources emulate incoming events. Each produces one of its sample messages every 0.1 seconds, so we have a steady stream to inspect.
Transform
transforms:
  transform_0:
    type: remap
    inputs:
      - source_*
    source: |
      . = parse_json!(.message)
      if .key == "a" {
        .group = 0
      } else {
        .group = 1
      }
The source_* input pattern connects both demo sources to the transform. The remap program parses each JSON message and sets group
to 0 when key is "a", or 1 otherwise. For quick iterations on the program, try the VRL playground.
HTTP sink
sinks:
  sink_0:
    type: http
    inputs:
      - transform_0
    uri: http://127.0.0.1:8000/logs
    healthcheck:
      enabled: false
    encoding:
      codec: json
    batch:
      timeout_secs: 1
The HTTP sink sends the transformed events to our server as JSON. Its one-second batch timeout keeps the example moving even when a batch has not reached its size limit. We’ll change its compression and batch settings in the scenarios below.
Follow events through the pipeline
Choose a tool based on the question you’re trying to answer:
| Question | Tool |
|---|---|
| Are events reaching each component? | vector top |
| What did a source or transform produce? | vector tap |
| Which component is reporting errors or discarding events? | The internal_metrics source |
| What HTTP headers and payload reached the destination? | The Python server’s output |
Compare component activity with vector top
In a third terminal, run:
vector top
Compare the events received and sent by the sources, transform, and HTTP sink. The starting configuration already enables the API needed
by vector top and vector tap.

Inspect events with vector tap
To see events before and after the transform, run:
vector tap --outputs-of source_0,transform_0
Look for the original message in the source output and the parsed fields, including group, in the transform output.
If you want to experiment with the remap program separately, use the VRL playground.

vector tap shows events at component boundaries. It doesn’t show the final HTTP request after the sink has encoded, batched, and
compressed those events. Use the receiving server’s output to inspect that request.Print events with a console sink
A console sink is also useful when you want to keep printing a component’s output.
For example, add debug_console under the existing sinks section to inspect the transform’s output:
sinks:
  debug_console:
    type: console
    inputs:
      - transform_0
    encoding:
      codec: json
      json:
        pretty: true
This is an optional diagnostic sink. The starting configuration already has a separate console sink, sink_1, for internal metrics.
Check internal metrics
The starting configuration includes an internal_metrics source:
sources:
  internal_metrics:
    type: internal_metrics
    scrape_interval_secs: 5
It connects to a console sink that prints those metrics in the Vector terminal:
sinks:
  sink_1:
    type: console
    inputs:
      - internal_metrics
    encoding:
      codec: json
Look at the tags.component_id field to identify the component. For our HTTP sink, this is sink_0.
| Metric | What to look for on sink_0 |
|---|---|
component_received_events_total | Is the sink still receiving events from the transform? |
component_sent_events_total | Is the sink successfully sending events? |
component_errors_total | Are errors increasing? |
component_discarded_events_total | Are events being dropped? |
http_client_responses_total | Which HTTP response codes is the destination returning? |
For example, this counter shows how many events the HTTP sink has received. The JSON below is formatted for readability. Your timestamps, host, and counter values will differ:
{
  "name": "component_received_events_total",
  "namespace": "vector",
  "tags": {
    "component_id": "sink_0",
    "component_kind": "sink",
    "component_type": "http",
    "host": "MY_HOST"
  },
  "timestamp": "2026-10-29T16:47:00.323055Z",
  "kind": "absolute",
  "counter": {
    "value": 100.0
  }
}
Compare the counters over time. A nonzero error count can reflect an earlier failure. If the count keeps increasing, errors are still happening. You can use the monitoring setup below to graph them.
Increase log verbosity when needed
For more detail, stop Vector with Ctrl+C and restart it with debug logging:
VECTOR_LOG=debug vector --watch-config --config vector-start.yaml
You can also select a specific Rust module. For example, to inspect HTTP sink retries while keeping other logs at info:
VECTOR_LOG=info,vector::sinks::util::retries=debug vector --watch-config --config vector-start.yaml
See the EnvFilter syntax for more filtering options.
Debug three common failures
Work through these scenarios in order, keeping the same vector-start.yaml. Use the third terminal for the curl commands.
Scenario 1: Unsupported compression
Trigger the failure. Add compression: gzip to sinks.sink_0 and save vector-start.yaml. Here is the HTTP sink with that change:
sinks:
  sink_0:
    type: http
    inputs:
      - transform_0
    uri: http://127.0.0.1:8000/logs
    healthcheck:
      enabled: false
    encoding:
      codec: json
    compression: gzip
    batch:
      timeout_secs: 1
Observe. In the server terminal, you’ll see Unsupported compression: gzip and an HTTP 400 response.
For example, the server output includes the request headers and explains why it rejected the payload:
Received POST /logs
content-type: application/json
content-encoding: gzip
accept-encoding: zstd,gzip,deflate,br
user-agent: Vector/0.59.0 (aarch64-apple-darwin a3231c7 2026-10-06 13:52:51.733983360)
host: 127.0.0.1:8000
content-length: 113

Unsupported compression: gzip. Use zlib or no compression.
127.0.0.1 - - [29/Oct/2026 12:47:02] "POST /logs HTTP/1.1" 400 -
Check the Vector logs and the HTTP sink’s component_errors_total and component_discarded_events_total counters as well.
An error metric looks like this:
{
  "name": "component_errors_total",
  "namespace": "vector",
  "tags": {
    "component_id": "sink_0",
    "component_kind": "sink",
    "component_type": "http",
    "error_type": "request_failed",
    "host": "MY_HOST",
    "stage": "sending"
  },
  "timestamp": "2026-10-29T16:47:05.323734Z",
  "kind": "absolute",
  "counter": {
    "value": 3.0
  }
}
Explain. The example server accepts uncompressed JSON and zlib-compressed JSON, but rejects gzip. Events reaching a sink does not mean the destination accepted them. In this case, the HTTP sink treats the 400 response as a failure it cannot retry and discards the batch.
Fix. Change that same setting to:
compression: zlib
Verify. After Vector reloads, the server should print decoded JSON again and return HTTP 200. The HTTP sink’s
component_sent_events_total should resume increasing. Previously discarded events are not recovered.
For other deployments, configuration reloading depends on how Vector is managed. For example, a systemd service can be reloaded with:
systemctl kill -s HUP --kill-who=main vector.service
See Managing Vector for more details.
Scenario 2: Temporary server disruptions
Trigger the failure. Ask the server to simulate rate limiting:
curl -X POST http://127.0.0.1:8000/set_status -H "Content-Type: application/json" -d '{"status": 429}'
The control request returns HTTP 200 to confirm the change. Subsequent requests to /logs receive HTTP 429.
Observe. Look for a retry warning in the Vector terminal:
Retrying after response. reason=Default retry strategy: Too Many Requests
The HTTP sink’s component_sent_events_total stops increasing. Its http_client_responses_total counter with status: "429"
increases as requests are retried. Here is an example of that response counter:
{
  "name": "http_client_responses_total",
  "namespace": "vector",
  "tags": {
    "component_id": "sink_0",
    "component_kind": "sink",
    "component_type": "http",
    "host": "MY_HOST",
    "status": "429"
  },
  "timestamp": "2026-10-29T16:47:10.322834Z",
  "kind": "absolute",
  "counter": {
    "value": 3.0
  }
}
Explain. The destination is temporarily refusing requests. Vector retries according to the HTTP sink’s retry policy. Retry behavior depends on the sink and response code.
Fix. Restore successful responses:
curl -X POST http://127.0.0.1:8000/set_status -H "Content-Type: application/json" -d '{"status": 200}'
Verify. Allow time for the next retry. The server should return HTTP 200 for /logs, and component_sent_events_total for
component_id: sink_0 should start increasing again. The counter for sink_1 measures console output.
For example:
{
  "name": "component_sent_events_total",
  "namespace": "vector",
  "tags": {
    "component_id": "sink_0",
    "component_kind": "sink",
    "component_type": "http",
    "host": "MY_HOST"
  },
  "timestamp": "2026-10-29T16:47:25.323010Z",
  "kind": "absolute",
  "counter": {
    "value": 484.0
  }
}
Scenario 3: Smaller batching
Trigger the failure. Stop the Python server with Ctrl+C, then restart it with a payload limit:
python3 http-server.py --max-bytes 256
This deliberately small limit makes the failure easy to reproduce with our demo events. The server measures the JSON body after
decompression. Keep Vector running with compression: zlib and the original batch settings.
Observe. The server reports a payload larger than 256 bytes and returns HTTP 413. Vector may briefly log connection errors while the server restarts. Once it’s running again, look for HTTP 413 responses. An example request looks like this:
Received POST /logs
content-type: application/json
content-encoding: deflate
accept-encoding: zstd,gzip,deflate,br
user-agent: Vector/0.59.0 (aarch64-apple-darwin a3231c7 2026-10-06 13:52:51.733983360)
host: 127.0.0.1:8000
content-length: 109

Payload is 888 bytes; limit is 256 bytes after decompression.
127.0.0.1 - - [29/Oct/2026 12:47:25] "POST /logs HTTP/1.1" 413 -
The content-length header describes the compressed body. The server’s error reports the larger, decompressed body that exceeded its limit.
Explain. The destination cannot accept a batch that large. The HTTP sink does not automatically split a rejected request into smaller batches. With the default retry policy, a 413 response causes the batch to be discarded.
Fix. Add max_events: 4 to the existing sinks.sink_0.batch section:
    batch:
      timeout_secs: 1
      max_events: 4
Verify. After the reload, requests should contain at most four events and receive HTTP 200. Check that the HTTP sink’s sent-event counter is increasing again.
Final configuration
vector-final.yaml contains the complete configuration after all three scenarios, including zlib compression and batches of up to four events:
api:
  enabled: true

sources:
  source_0:
    type: demo_logs
    format: shuffle
    lines:
      - '{ "key": "a", "property": "foo" }'
      - '{ "key": "b", "property": "bar" }'
    interval: 0.1

  source_1:
    type: demo_logs
    format: shuffle
    lines:
      - '{ "key": "c", "property": "some" }'
      - '{ "key": "d", "property": "another" }'
    interval: 0.1

  internal_metrics:
    type: internal_metrics
    scrape_interval_secs: 5

transforms:
  transform_0:
    type: remap
    inputs:
      - source_*
    source: |
      . = parse_json!(.message)
      if .key == "a" {
        .group = 0
      } else {
        .group = 1
      }

sinks:
  sink_0:
    type: http
    inputs:
      - transform_0
    uri: http://127.0.0.1:8000/logs
    healthcheck:
      enabled: false
    encoding:
      codec: json
    compression: zlib
    batch:
      timeout_secs: 1
      max_events: 4

  sink_1:
    type: console
    inputs:
      - internal_metrics
    encoding:
      codec: json
This file is already in the downloaded folder. Stop the running Vector process before trying it:
vector --watch-config --config vector-final.yaml
You now have a way to check each stage: inspect events with tap, compare component counters, and confirm what the destination receives.
You can also add Vector configuration unit tests for your transform’s expected output.
When you’re finished, stop Vector and the Python server with Ctrl+C.
Visualize and query internal metrics
The console is enough for the walkthrough. For longer investigations, send the same internal metrics to Datadog or Prometheus/Grafana so you can compare changes over time.
Both setups use the files you downloaded at the start. Run python3 http-server.py again if you stopped the server.
Stop any running Vector process before switching configurations.
Datadog Metrics
Use vector-datadog.yaml, which extends vector-final.yaml with this sink:
  sink_2:
    type: datadog_metrics
    inputs:
      - internal_metrics
    default_api_key: "${DATADOG_API_KEY}"
Set DATADOG_API_KEY in Vector’s environment before starting the process. If your account uses a different Datadog site, set the sink’s
site option too. Then start Vector:
vector --watch-config --config vector-datadog.yaml
Open the Datadog Metrics Explorer and search for Vector metrics. For example:
sum:vector.component_sent_events_total{component_id:sink_0}.as_count()
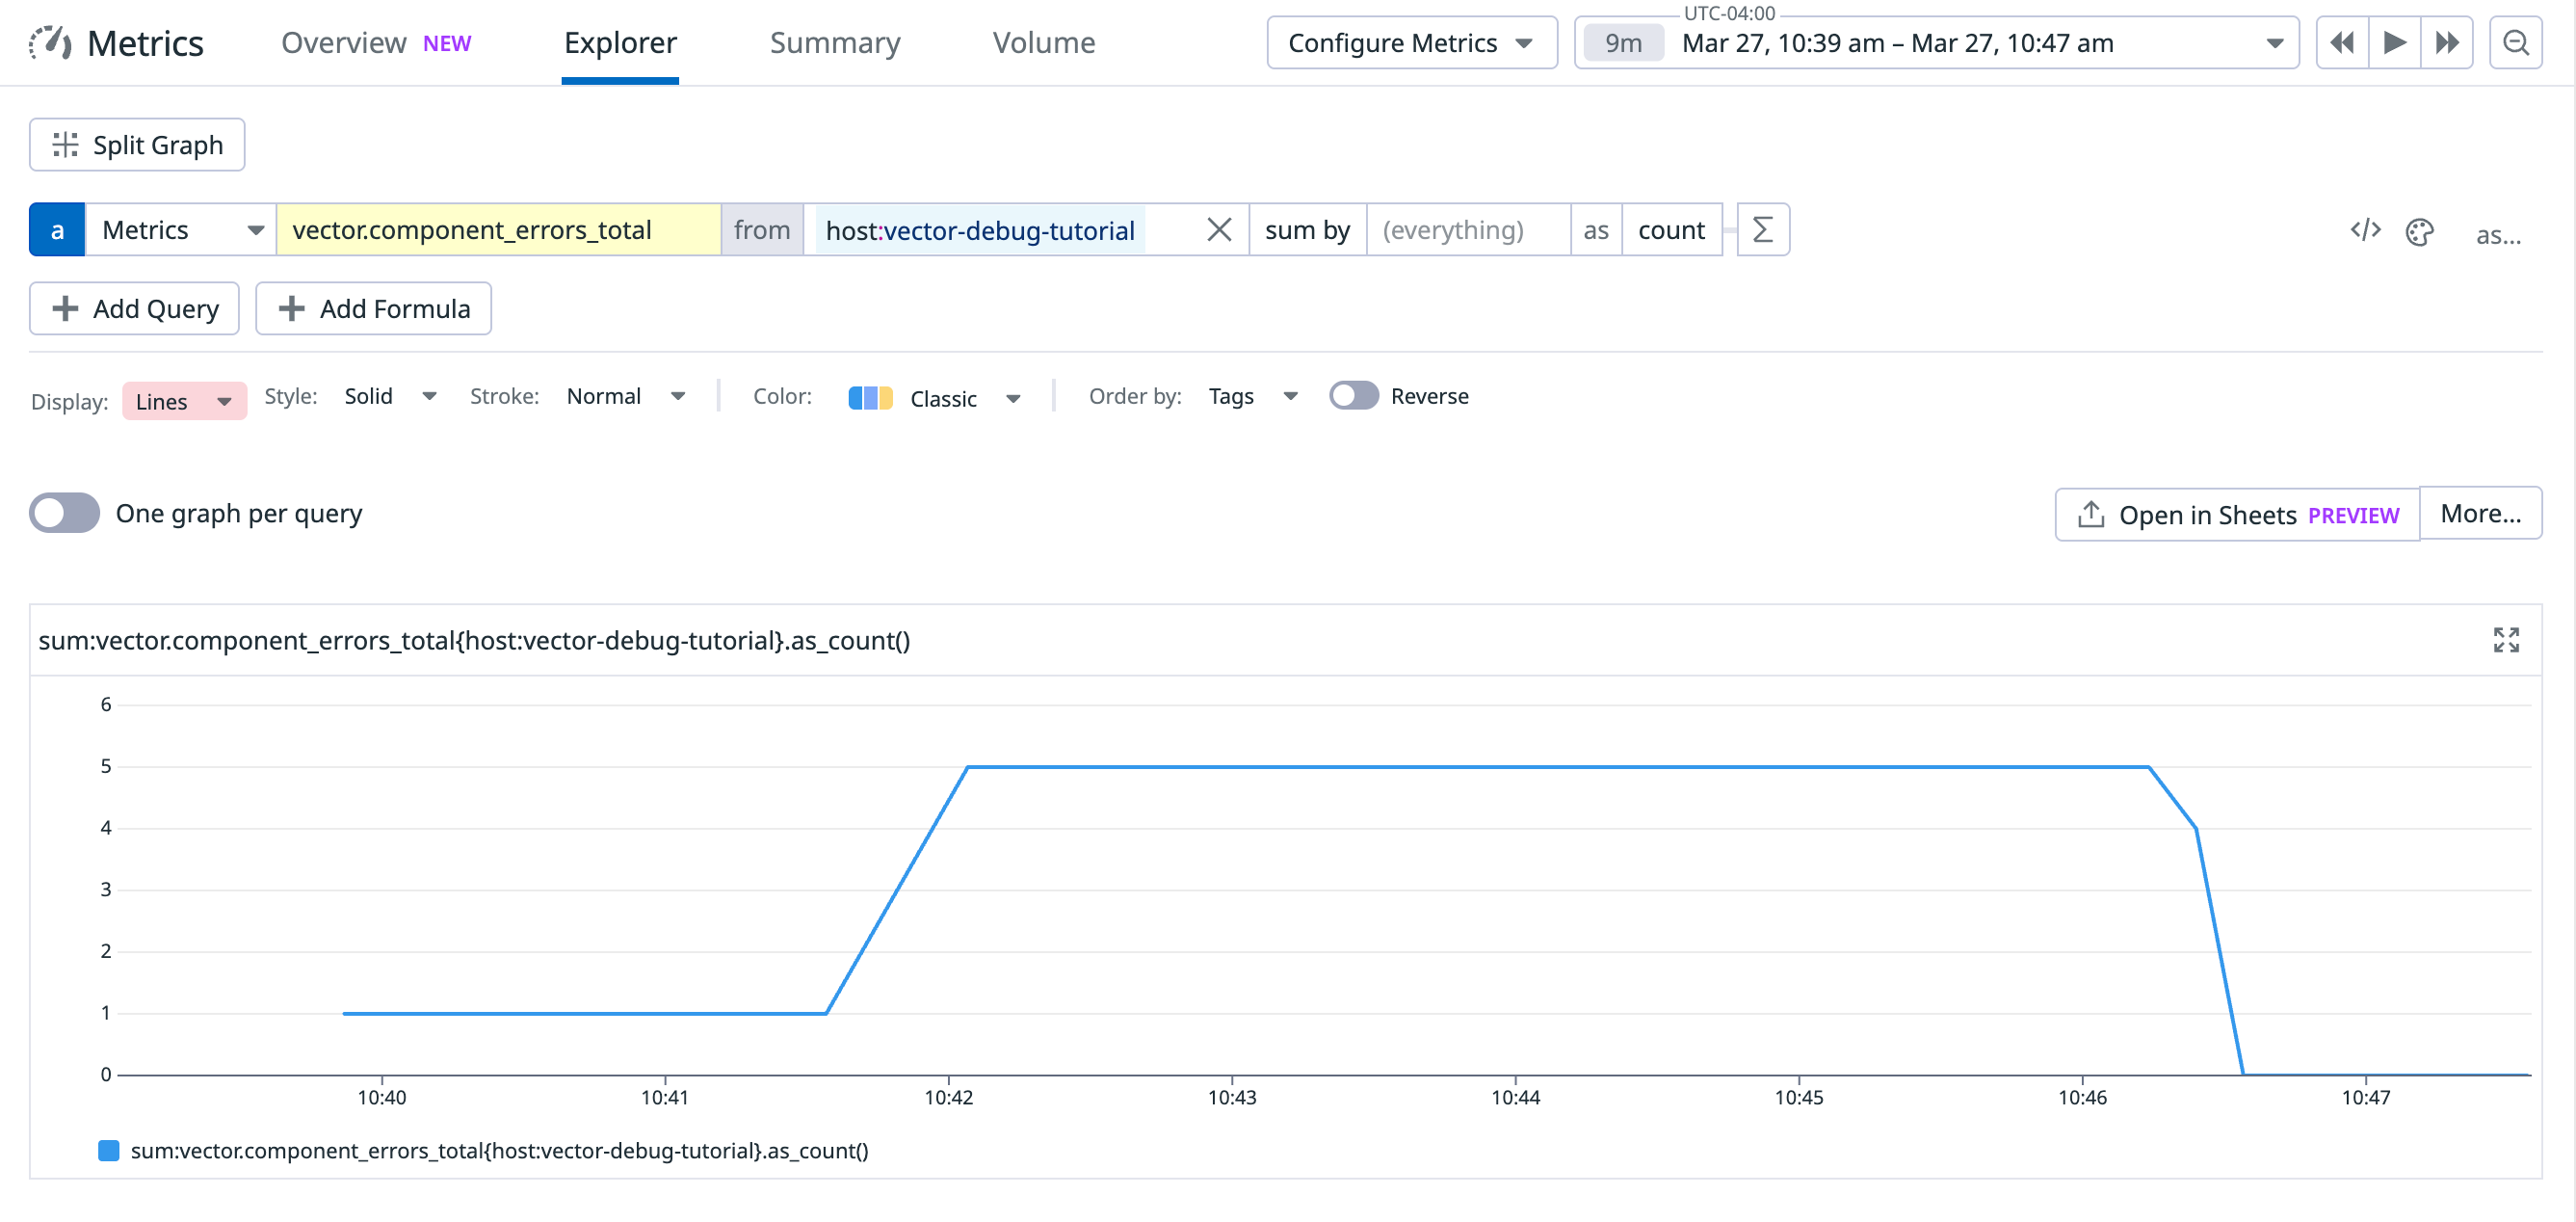
You can collect related queries in a notebook to keep the investigation in one place.
Prometheus and Grafana
For this setup, run Vector and the Python server on your host. Run Prometheus and Grafana with Docker Compose.
This configuration uses Docker Desktop’s host.docker.internal hostname. On Linux Docker Engine, extra_hosts adds that hostname.
Use vector-prometheus.yaml, which extends vector-final.yaml with this sink:
  sink_2:
    type: prometheus_exporter
    inputs:
      - internal_metrics
    address: 0.0.0.0:9598
Here is the complete vector-prometheus.yaml:
api:
  enabled: true

sources:
  source_0:
    type: demo_logs
    format: shuffle
    lines:
      - '{ "key": "a", "property": "foo" }'
      - '{ "key": "b", "property": "bar" }'
    interval: 0.1

  source_1:
    type: demo_logs
    format: shuffle
    lines:
      - '{ "key": "c", "property": "some" }'
      - '{ "key": "d", "property": "another" }'
    interval: 0.1

  internal_metrics:
    type: internal_metrics
    scrape_interval_secs: 5

transforms:
  transform_0:
    type: remap
    inputs:
      - source_*
    source: |
      . = parse_json!(.message)
      if .key == "a" {
        .group = 0
      } else {
        .group = 1
      }

sinks:
  sink_0:
    type: http
    inputs:
      - transform_0
    uri: http://127.0.0.1:8000/logs
    healthcheck:
      enabled: false
    encoding:
      codec: json
    compression: zlib
    batch:
      timeout_secs: 1
      max_events: 4

  sink_1:
    type: console
    inputs:
      - internal_metrics
    encoding:
      codec: json

  sink_2:
    type: prometheus_exporter
    inputs:
      - internal_metrics
    address: 0.0.0.0:9598
prometheus.yaml tells Prometheus where to scrape Vector:
global:
  scrape_interval: 5s

scrape_configs:
  - job_name: vector
    static_configs:
      - targets: ["host.docker.internal:9598"]
compose.yaml starts Prometheus and Grafana and mounts that scrape configuration:
services:
  prometheus:
    image: prom/prometheus:latest
    ports:
      - "127.0.0.1:9090:9090"
    volumes:
      - ./prometheus.yaml:/etc/prometheus/prometheus.yml:ro
    extra_hosts:
      - "host.docker.internal:host-gateway"

  grafana:
    image: grafana/grafana:latest
    ports:
      - "127.0.0.1:3000:3000"
    environment:
      - GF_SECURITY_ADMIN_PASSWORD=admin
    depends_on:
      - prometheus
Start Vector in its terminal:
vector --watch-config --config vector-prometheus.yaml
In another terminal, start the monitoring services from the same folder:
docker compose up -d
- Open Grafana and log in with username
adminand passwordadmin. - Add a Prometheus data source with the URL
http://prometheus:9090. - Create a dashboard and query
vector_component_errors_total{component_id="sink_0"}orvector_component_discarded_events_total{component_id="sink_0"}. - To see how many events were discarded recently, try
increase(vector_component_discarded_events_total{component_id="sink_0"}[5m]).
For more detail, see Grafana’s Prometheus setup guide.
When you’re finished, stop the containers with docker compose down.